Suntory PepsiCo Vietnam Beverage · Enterprise data
Suntory PepsiCo Vietnam: an Enterprise Data Hub for shared reporting
Twin delivered an Enterprise Data Hub for Suntory PepsiCo Vietnam Beverage, bringing information from core business systems into a shared, governed foundation for reporting, analysis and cross-functional decision-making.

About Suntory PepsiCo Vietnam Beverage
A national beverage business with reporting needs across the operation
Suntory PepsiCo Vietnam Beverage is the strategic alliance between Japan’s Suntory and PepsiCo of the United States. Its published company profile lists six manufacturing plants, five offices and nearly 3,000 direct employees across Vietnam.
The business continues to expand. Vietnam Government News reported the opening of its Tay Ninh plant on 10 July 2026, with designed capacity of approximately 1.2 billion litres a year. That operating scale provides the context for Twin’s Enterprise Data Hub: shared reporting across sales, inventory, supply chain, finance, production, procurement and marketing.
Company profile checked 26 October 2026. Plant capacity is a business expansion milestone; it is designed capacity, rather than actual output or the coverage of Twin’s programme.
Customer challenge
A common view of information from different systems
Sales, Inventory, Supply Chain, Finance, Production, Procurement and Marketing used information from different operational systems. Cross-functional reporting required teams to collect and reconcile those views.
The programme connected the sources and established the ownership, definitions and governance needed for shared reporting.
Twin built an Enterprise Data Hub that brought information from systems including DMS, SAP, MEMS, CMMS and Excel into a shared data and business-intelligence environment.
The delivery scope
Five named source families, seven business functions and a shared data foundation
The programme brought DMS, SAP, MEMS, CMMS and Excel sources into a common environment. Source integration sat alongside data ownership, quality responsibilities and common records, so reporting teams could work from a shared foundation.
Business data sources
- DMS
- SAP
- MEMS
- CMMS
- Excel and business files
Enterprise Data Hub
- Consolidation and data preparation
- Data owners and stewards
- Data quality responsibilities
- Master Data Management for shared records
Reporting and analysis
- Cross-functional business intelligence
- Sales and distributor reporting
- Profitability and cost analysis
- Self-service reporting
- Forecasting and planning use cases
Business functions covered in the programme: Sales, Inventory, Supply Chain, Finance, Production, Procurement and Marketing. The source list describes system families; forecasting and predictive analysis are programme use cases.
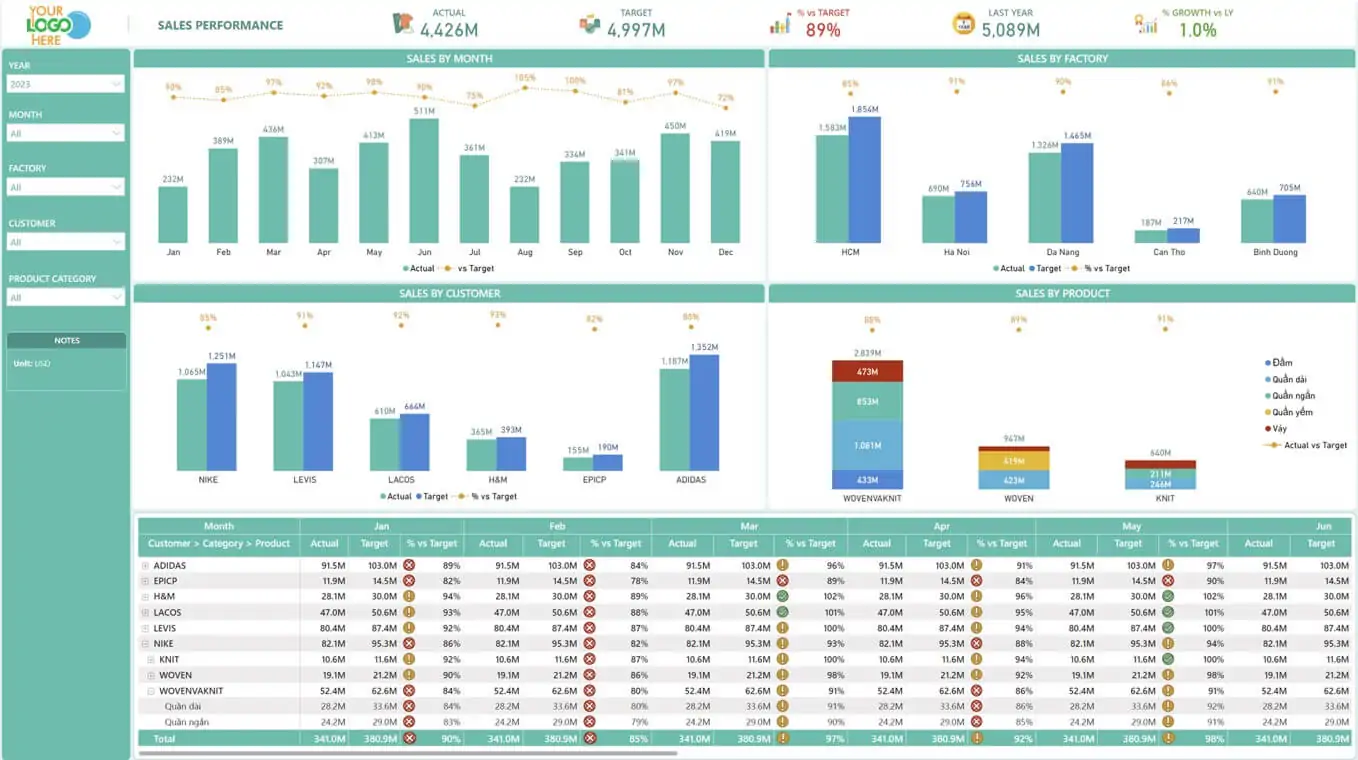
Illustrative reporting views
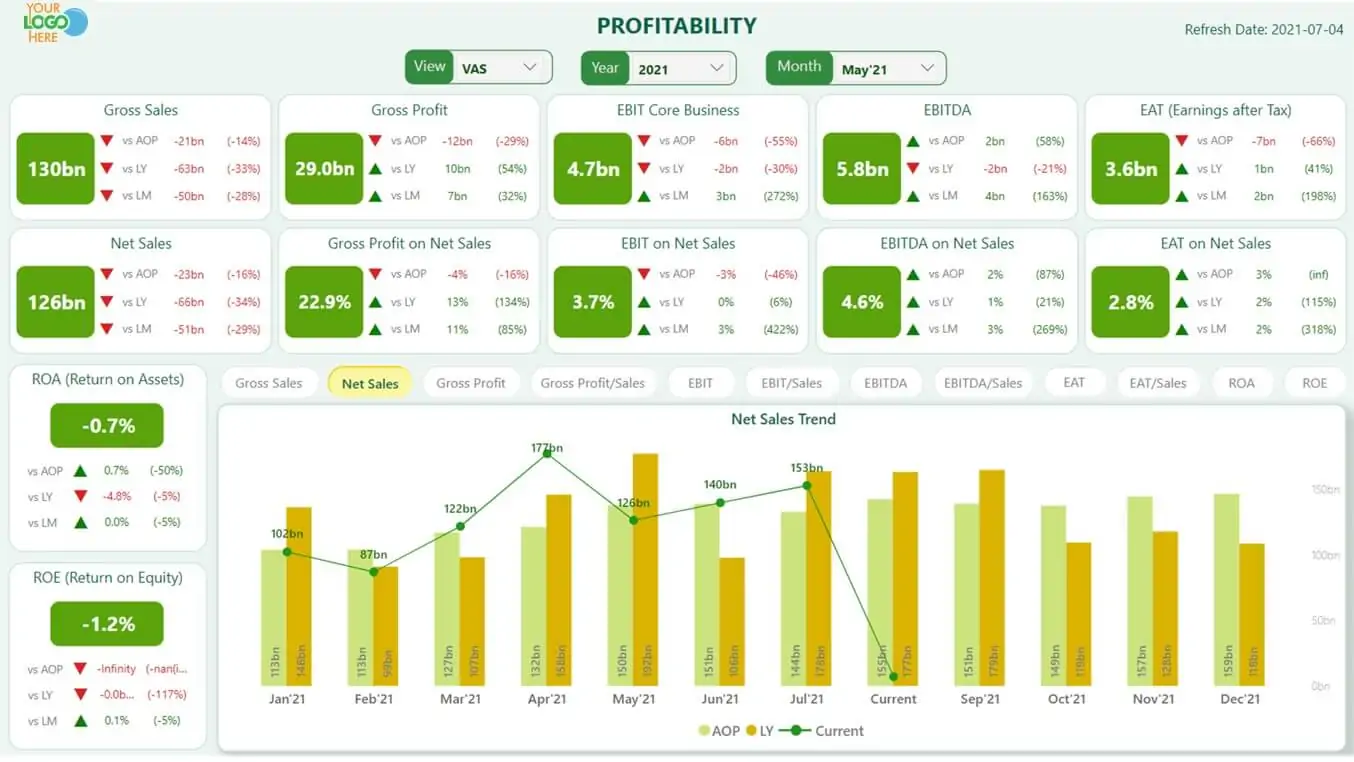
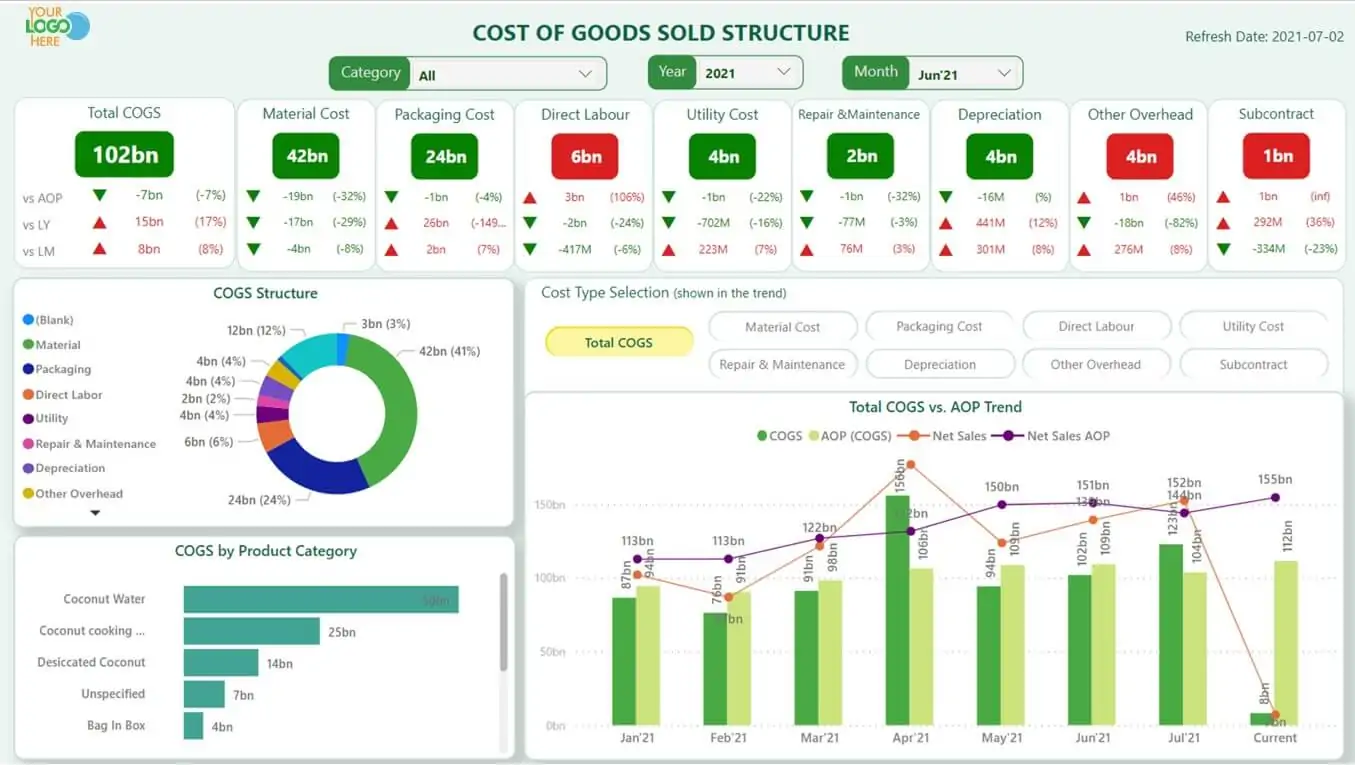
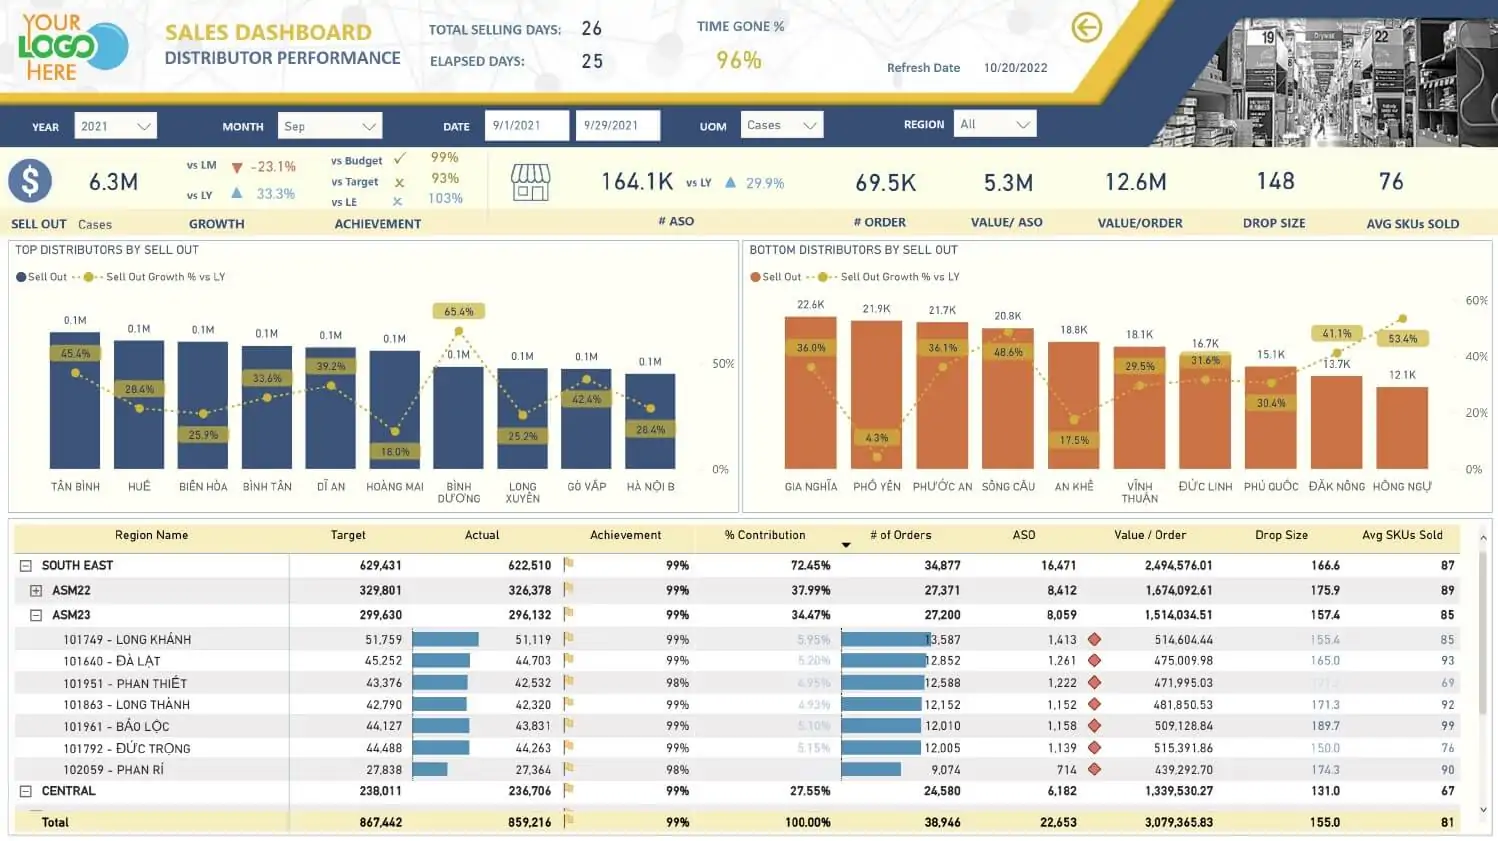
Sample dashboards showing comparable reporting ideas
Sample dashboards. Production dashboards are private. These examples use sample data to illustrate similar reporting ideas; the layouts and figures are not Suntory PepsiCo production screens or business results.
Why the data foundation mattered
Shared records and definitions for recurring business reporting
The hub gave business teams a shared foundation for preparing reports across functions. Integration and data stewardship were handled together, allowing analysis to use common records and definitions. The programme was designed to reduce repeated collection and reconciliation and make more reporting available to business users.
A broader engineering task than the dashboard alone
The work combined source connections, data preparation, ownership and Master Data Management with reporting. A useful dashboard depended on the information and responsibilities underneath it.
Project value
A shared data foundation for recurring business decisions
The Enterprise Data Hub brought information from DMS, SAP, MEMS, CMMS and Excel into a common foundation serving seven business functions. Agreed ownership, master data and quality controls gave recurring reports a more consistent basis.
This made the programme useful beyond an individual dashboard: teams could work from shared records and definitions when reviewing sales, operations and finance. The sample dashboard images illustrate comparable reporting patterns; the client’s production reports remain private.
Build a reporting foundation teams can trust
Discuss your data-platform requirements
Talk to Twin about enterprise source integration, governed data, reporting and analytics tied to the decisions your teams actually make.